
Where the kilowatts go, finally answerable.
Utility feed to rack PDU, metered and explained.
Track power usage from utility feeds to rack-level PDUs, identify waste and support sustainability goals with intelligent energy analytics in ProDCIM.
- kWh & demand
- PUE & CUE
- Sub-metering
- Carbon & ESG
PUE, per zone
68%
renewable share
carbon trending down
Energy by month
GridRenewableFrom the feed to the outlet
Metered at every level that matters.
Track power usage from utility feeds to rack-level PDUs, identify waste and support sustainability goals with intelligent energy analytics in ProDCIM.
Settlement-grade meter
Match the utility bill before it lands: interval data, demand peaks and power factor at the point of common coupling.
- Interval
- Demand
- Power factor
Per-board sub-metering
Break out kWh by lighting, HVAC, IT and life-safety. See which board surged when the bill spiked, without arguing.
- By board
- kWh
- Attributable
Outlet-level metering
Per-outlet kWh, voltage and current for every rack. Allocate to tenants, find stranded capacity, kill zombie servers with data.
- Per-outlet
- Per-tenant
- Stranded capacity
What bulk meters hide
Six line items that hide on bulk meters, surfaced.
Most facilities meter at the utility entrance and stop. That hides waste, oversizing, stranded capacity and the easy sustainability wins. ProDCIM's energy layer rolls every meter into one continuous timeline.
Cooling overshoot
Stranded capacity
Ghost / idle loads
PUE drift overnight
Demand-charge spikes
Chargeback gaps
One energy timeline
outlet → rack → site
Rack-level visibility surfaces the 5 to 10 percent sustainability wins
15-min
Interval data, per circuit
PUE & CUE
Per zone, not just averages
Utility → rack
Metered end to end
Carbon
ESG disclosure-ready
Capabilities
Six analytics built for facilities and sustainability teams.
Not a generic BI tool with an energy dashboard tacked on, these are the views ops and ESG teams asked us to build.
kWh & demand tracking
15-minute interval data per circuit, per rack, per tenant, historical, exportable, audit-ready.
PUE & CUE
Live power-usage and carbon-usage effectiveness, broken down by zone, not just whole-facility averages.
Baseline anomaly detection
Models learn normal load for each circuit; surface what's out-of-band before it shows up on the bill.
Peak-demand alerts
Get notified when projected peak demand will trigger a charge, and what's driving it, before it's locked in.
Sustainability reports
Generation, consumption and CO2-avoided rolled up for ESG disclosure, formatted for the common reporting frameworks.
Granular roll-up
Roll up from outlet to rack to row to room to site without losing the underlying numbers.
How it works
Energy savings the auditor will sign off on.
Every claimed kWh saving is backed by metered evidence, not modelled assumptions. The same numbers run the bill, the analytics and the report.
1. Meter
Capture interval data from utility, distribution and PDU points-of-measure.
2. Analyze
Baseline normal load, flag anomalies, allocate to circuits, tenants and IT loads.
3. Recommend
Surface the top opportunities, and the kWh and dollars each one is worth.
4. Verify
Measure before and after with the same meter chain. Defensible numbers.
On the platform
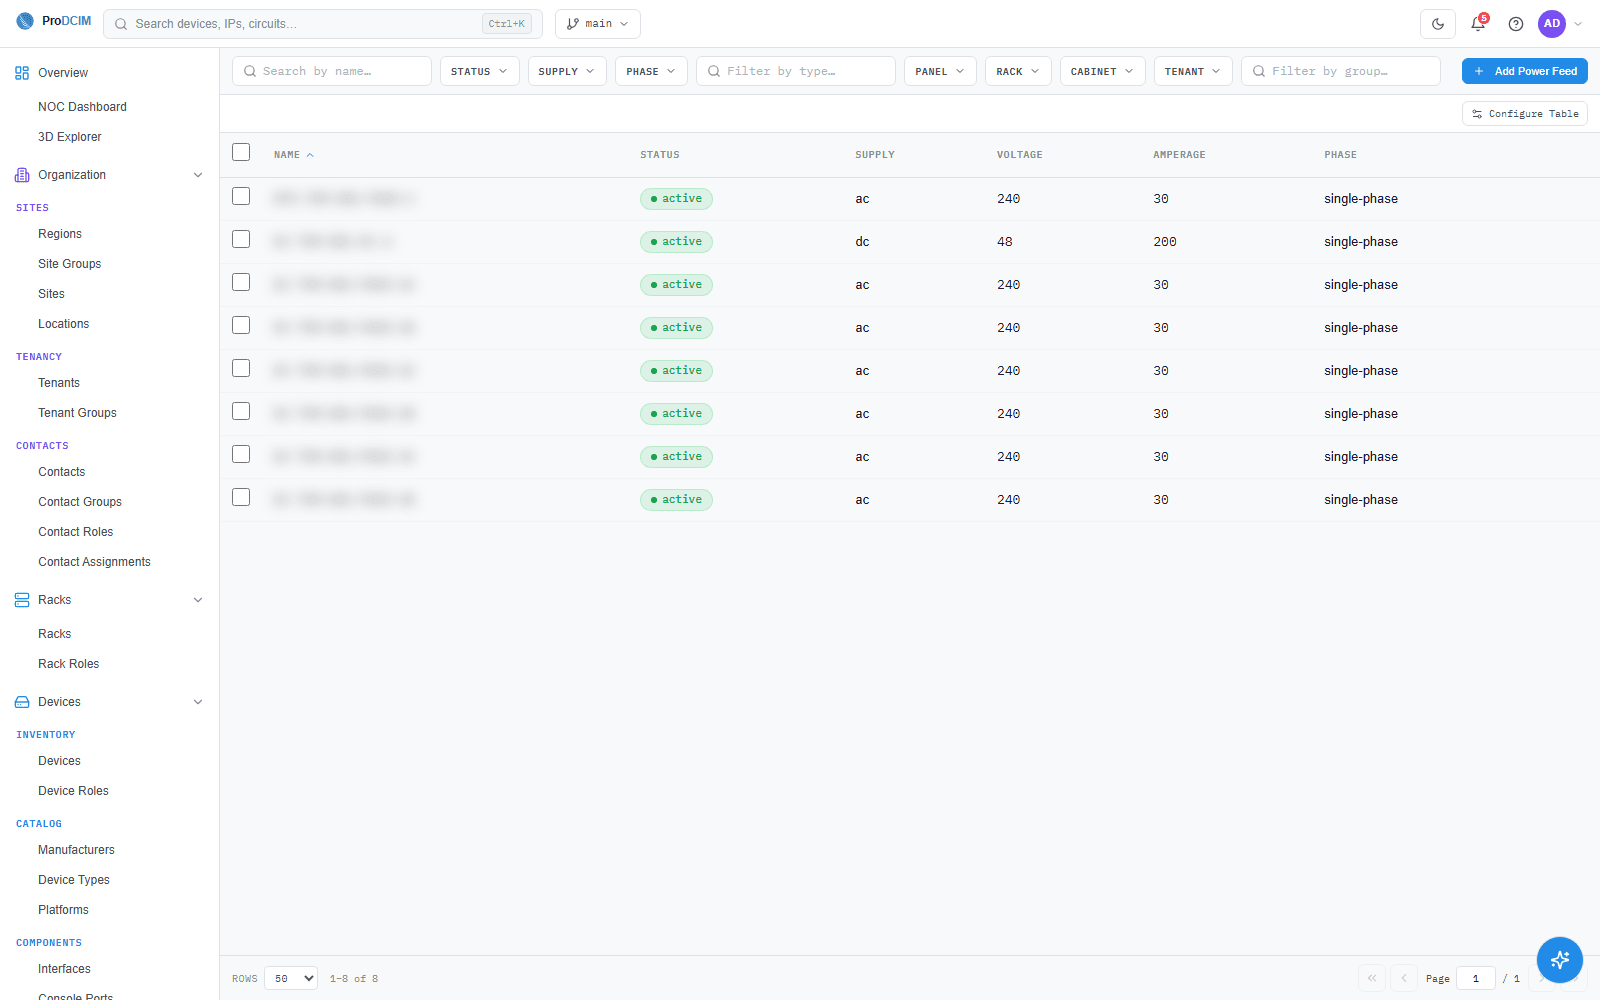
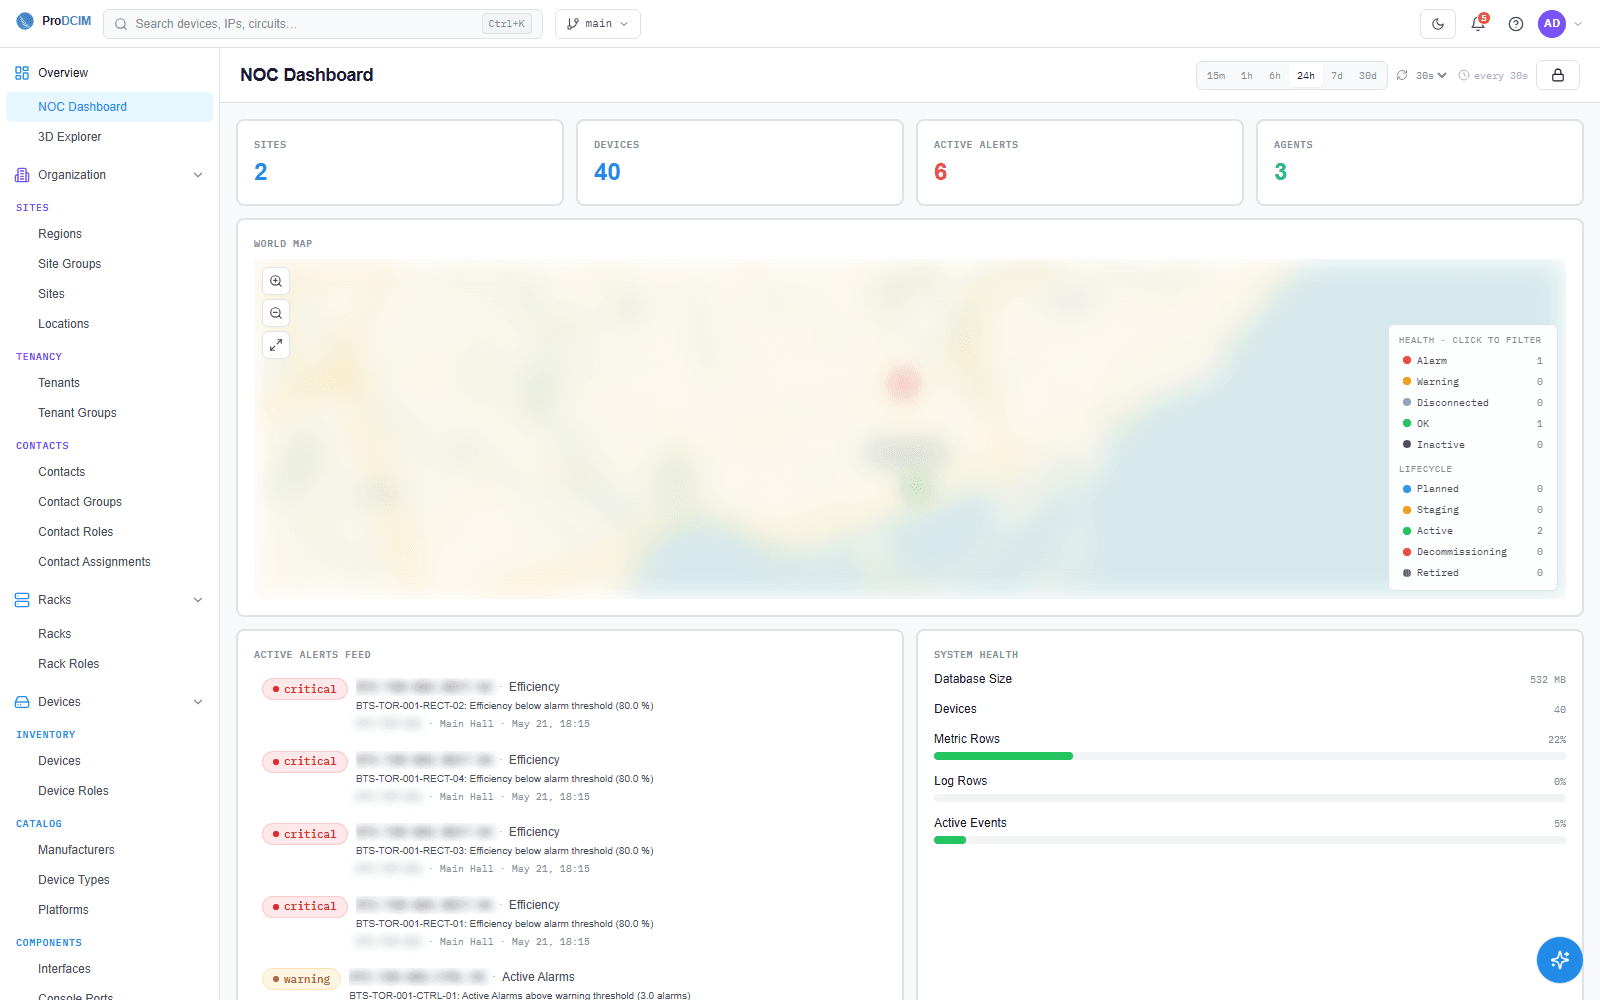
Energy, from the feed to the rack.
Sample platform data shown.
Part of the platform
Better together, on one platform.
Explore at your own pace
Not ready for a demo? Take the next step.
Find out where your kilowatts go
Book a walkthrough and we'll map your feeds, boards and racks into one energy picture.
FAQ